


First published: 5 February 2021 – auf Deutsch lesen
Statistics Vienna is monitoring the developments of weekly deaths (all-cause mortality) in selected European countries, cities and metropolitan areas from January 2020 until June 2022. The analyses show significant deviations of 2020 and 2021 death counts from expected mortality in many cities and countries. The expected number of deaths is based on a linear extrapolation of the trend in the reference period from 2015 to 2019. In contrast to the mortality monitoring in Austria’s provinces, which also employs the Vienna Mortality Monitoring Methodology, changes in the population size and age structure are not taken into account due to lack of current data.
Charts on mortality in this article:
Mortality analyses by Statistics Vienna
Comparing European countries
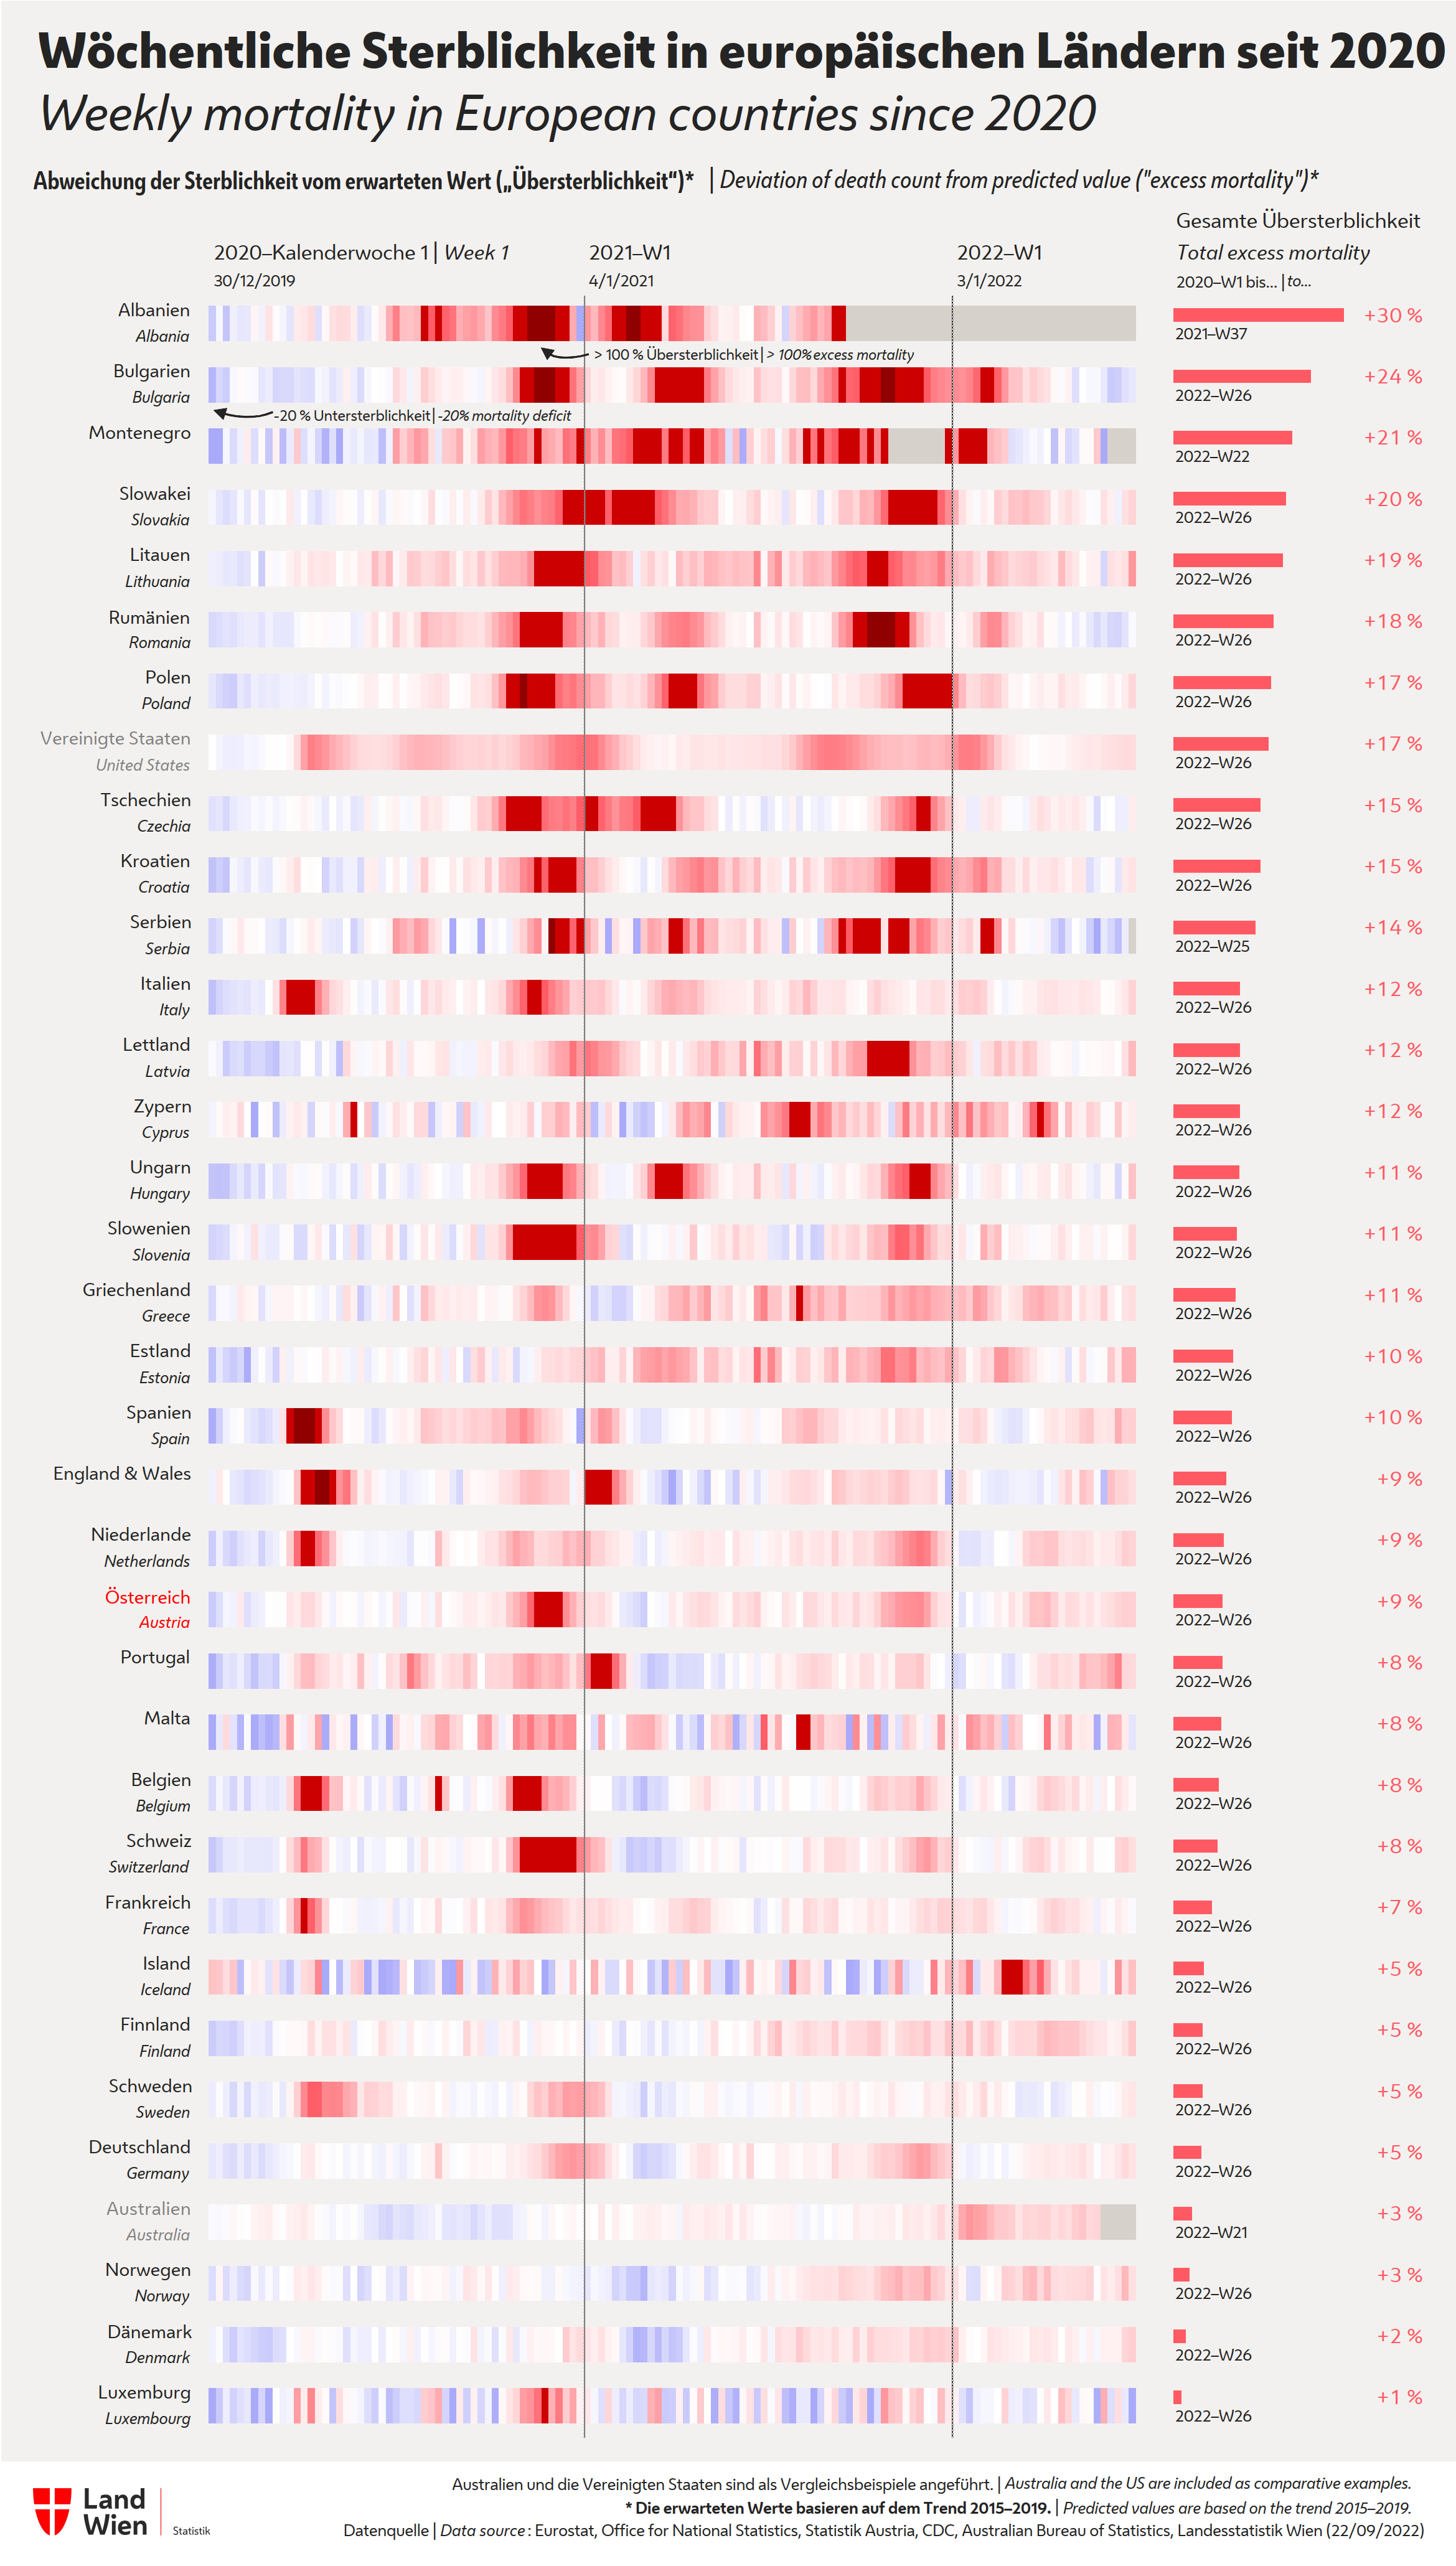
The COVID-19 pandemic affected European countries differently. Colour patterns in the main section of the chart („heatmap“) indicate four big waves of excess mortality in Europe, in spring and in autumn/winter of 2020 and 2021, resepectively. Most Eastern European nations were hit harder.
The preliminary balance of excess mortality in the right column shows that up to 20% more deaths were counted in many countries since January 2020 compared to expected mortality – among them Poland, Slovakia, Romania and Bulgaria. By contrast, mortality in Denmark, Norway and Iceland did not show big anomalies – so far. With around 10% excess mortality, Austria ranks among the European average.
Selection of countries and cities & quality of data
-
We included all European countries and capital cities plus cities with more than one million inhabitants of which Eurostat published weekly death figures on NUTS level in our monitoring. Many NUTS 3 regions (smallest unit) are considerably larger than the respective city limits, e.g. Milan and Zurich; these cases are highlighted in the respective charts by the term „…region“. In Paris and Athens, we used the NUTS 2 region to depict the entire metropolitan area. Please note that data quality varies between cities and regions. Eurostat does not provide any information on the definitions and classifications used. Hence, it is possible that some cities reported incomplete figures for 2020 and 2021 (e.g. not including deaths abroad), but complete data for previous years; some countries may aggregate the number of deceased not by date of death but by the reporting date, like the UK. Data quality of the most current weeks‘ death counts may vary between countries and cities.
- Mortality data of German cities, England/Wales and London, the United States as well as Australia shown here are provided by the German Federal Statistical Office (Destatis), the Office for National Statistics, the Centers for Disease Control and Prevention (CDC) and the Australian Bureau of Statistics. Realiable data on Austria and Vienna are provided by Statistics Austria.
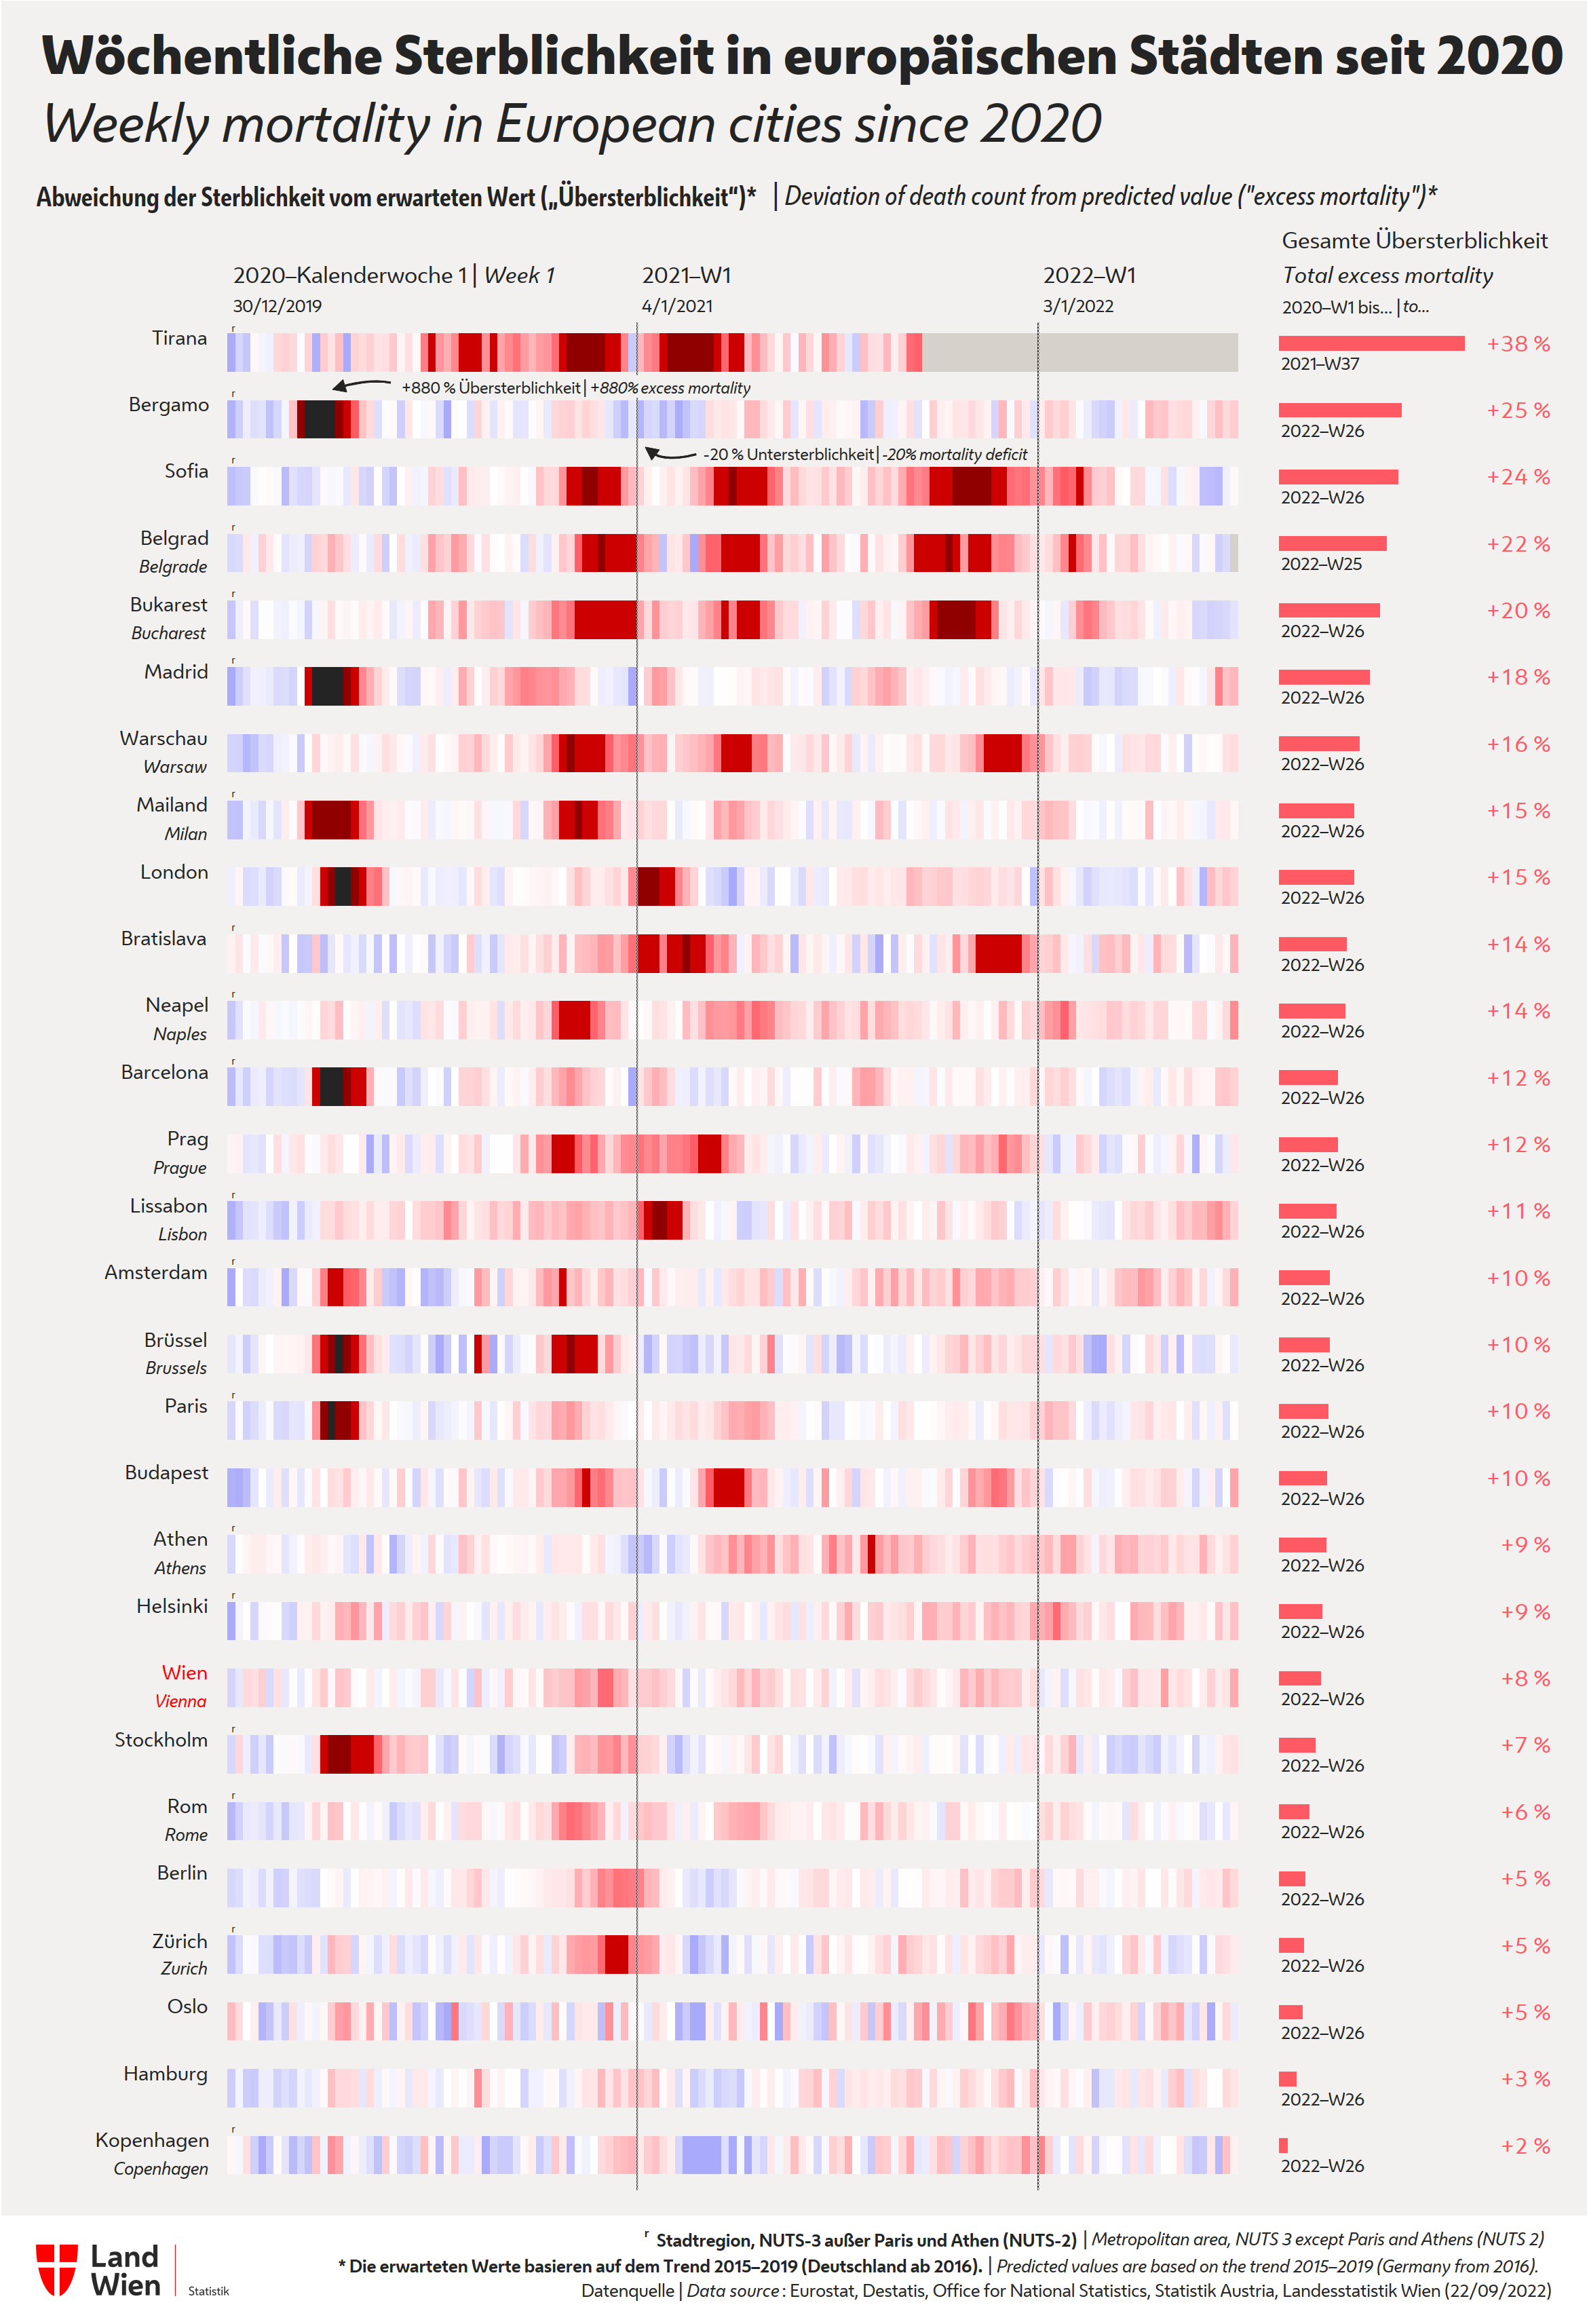
Comparing European cities: overview
Excess mortality during the COVID-19 pandemic varies not only between European nations; sometimes even cities within the same country are hit differently: Milan and Bergamo, for example, reported a highly increased number of deaths in spring, while mortality in Rome showed no deviations from the previous years during this period.
Comparing European cities in detail
Enlarge chart / URL to embed and share
Northern Europe
Enlarge chart / URL to embed and share
Enlarge chart / URL to embed and share
Enlarge chart / URL to embed and share
Enlarge chart / URL to embed and share
Central and Eastern Europe
Enlarge chart / URL to embed and share
Enlarge chart / URL to embed and share
Enlarge chart / URL to embed and share
Enlarge chart / URL to embed and share
Enlarge chart / URL to embed and share
Enlarge chart / URL to embed and share
Enlarge chart / URL to embed and share
Enlarge chart / URL to embed and share
Western Europe
Enlarge chart / URL to embed and share
Enlarge chart / URL to embed and share
Enlarge chart / URL to embed and share
Enlarge chart / URL to embed and share
Enlarge chart / URL to embed and share
Enlarge chart / URL to embed and share
Enlarge chart / URL to embed and share
Southern Europe
Enlarge chart / URL to embed and share
Enlarge chart / URL to embed and share
Enlarge chart / URL to embed and share
Enlarge chart / URL to embed and share
Enlarge chart / URL to embed and share
Enlarge chart / URL to embed and share
Enlarge chart / URL to embed and share
Enlarge chart / URL to embed and share
Data
Weekly deaths in Austria (without deaths in foreign countries) since 2000 (Statistics Austria)
Weekly deaths in European NUTS regions (Eurostat)
Weekly deaths in German Länder (Destatis)
Data handling: Statistics Vienna
More information
Mortality Monitoring in Austria’s Provinces 2020–2022
Vienna Mortality Monitoring 2007–2020
EuroMOMO (European Mortality Monitoring): Current analysis of mortality in European countries
Eurostat NUTS classification (Nomenclature of Territorial Units for Statistics): Informationen and map (NUTS 3 2016)
Corona and fertility in Vienna (in German)