


First published: 28 June 2020 – auf Deutsch lesen
In Austria, the first corona death occurred in mid-March 2020. Since then, there is a growing interest in the question as to whether, when and to which extent the COVID-19 pandemic has led to increased overall mortality. For this reason, Statistics Vienna (MA 23) evaluates mortality trends in Austria’s nine provinces with regard to unusual events. We apply the Vienna Mortality Monitoring Methodology and use data provided by Statistics Austria.
Mortality analyses by Statistics Vienna
In order to assess whether there was any excess mortality we defined the range of the expected number of weekly deaths. The prediction intervals (“bands”) comprise 99% of the expected values assuming a random and independent distribution of the weekly number of deaths by age group (0 to 64 years or 65 years and older). The “bands” take into account seasonal fluctuations and changes in the population size, age structure, and life expectancy – see our technical report.
Our analyses include all deaths of people with a residence in the Austrian provinces who died in Austria. The data originates from the Register of Vital Statistics (ZPR) and is provided by Statistics Austria. Please note that the data is still preliminary. The number of deaths of the two latest available weeks have not yet been fully registered and are therefore partially estimated by Statistics Austria. Data on weekly deaths since 2007 in Austria’s provinces (NUTS 2) as well as the prediction intervals are published at the Austrian Open Data portal.
Click on chart to enlarge
Update 2022: preliminary data and methodological update
- At the beginning of 2022, the mortality monitoring method was updated and previous data issues were resolved. First and foremost, the expected numbers of weekly deaths are now smoothed across a longer period of time in order to avoid „jumps“ at the turn of years. These changes will be visible in the charts from 27 January 2022 onwards. The details are described in our technical report (including the R code).
The expected numbers of weekly deaths are usually based on data of daily deaths in the previous five years. Please note that for 2021 and 2022, the reference period continues to range from 2015 to 2019. The exceptional mortality in 2020 and 2021 due to the COVID-19 pandemic must be treated as an outlier and is therefore not applicable for assessing future mortality. Furthermore, we use preliminary data on the population size and age structure of 1 January 2022 to compute the expected number of deaths for 2022.
Weekly deaths in Austria’s nine provinces since January 2020
The following charts show the number of weekly deaths in Austria (excluding deaths of Austrian residents that happened abroad) and the range of the expected values (i.e. the prediction interval). When interpreting the charts it should be taken into account that the prediction intervals are not intended to show events of a comparable strength. The prediction intervals rather show how clearly excess mortality can be assessed for the respective week in the respective region (statistical significance).
Population size determines the width of the prediction interval and thus how clearly excess mortality can be assessed. The greater the population (and, hence, number of corresponding deaths), the narrower is the expected variance in weekly deaths, which in turn allows a more precise identification of excess mortality. Therefore, the magnitude of the deviation of actual deaths from the prediction interval is only comparable between provinces with a similar population size (e.g. between Vienna and Lower Austria).
Enlarge chart/URL to embed and share
Enlarge chart/URL to embed and share
Enlarge chart/URL to embed and share
Enlarge chart/URL to embed and share
Enlarge chart/URL to embed and share
Enlarge chart/URL to embed and share
Enlarge chart/URL to embed and share
Enlarge chart/URL to embed and share
Enlarge chart/URL to embed and share
Enlarge chart/URL to embed and share
Archive: Overview January 2020 to June 2022
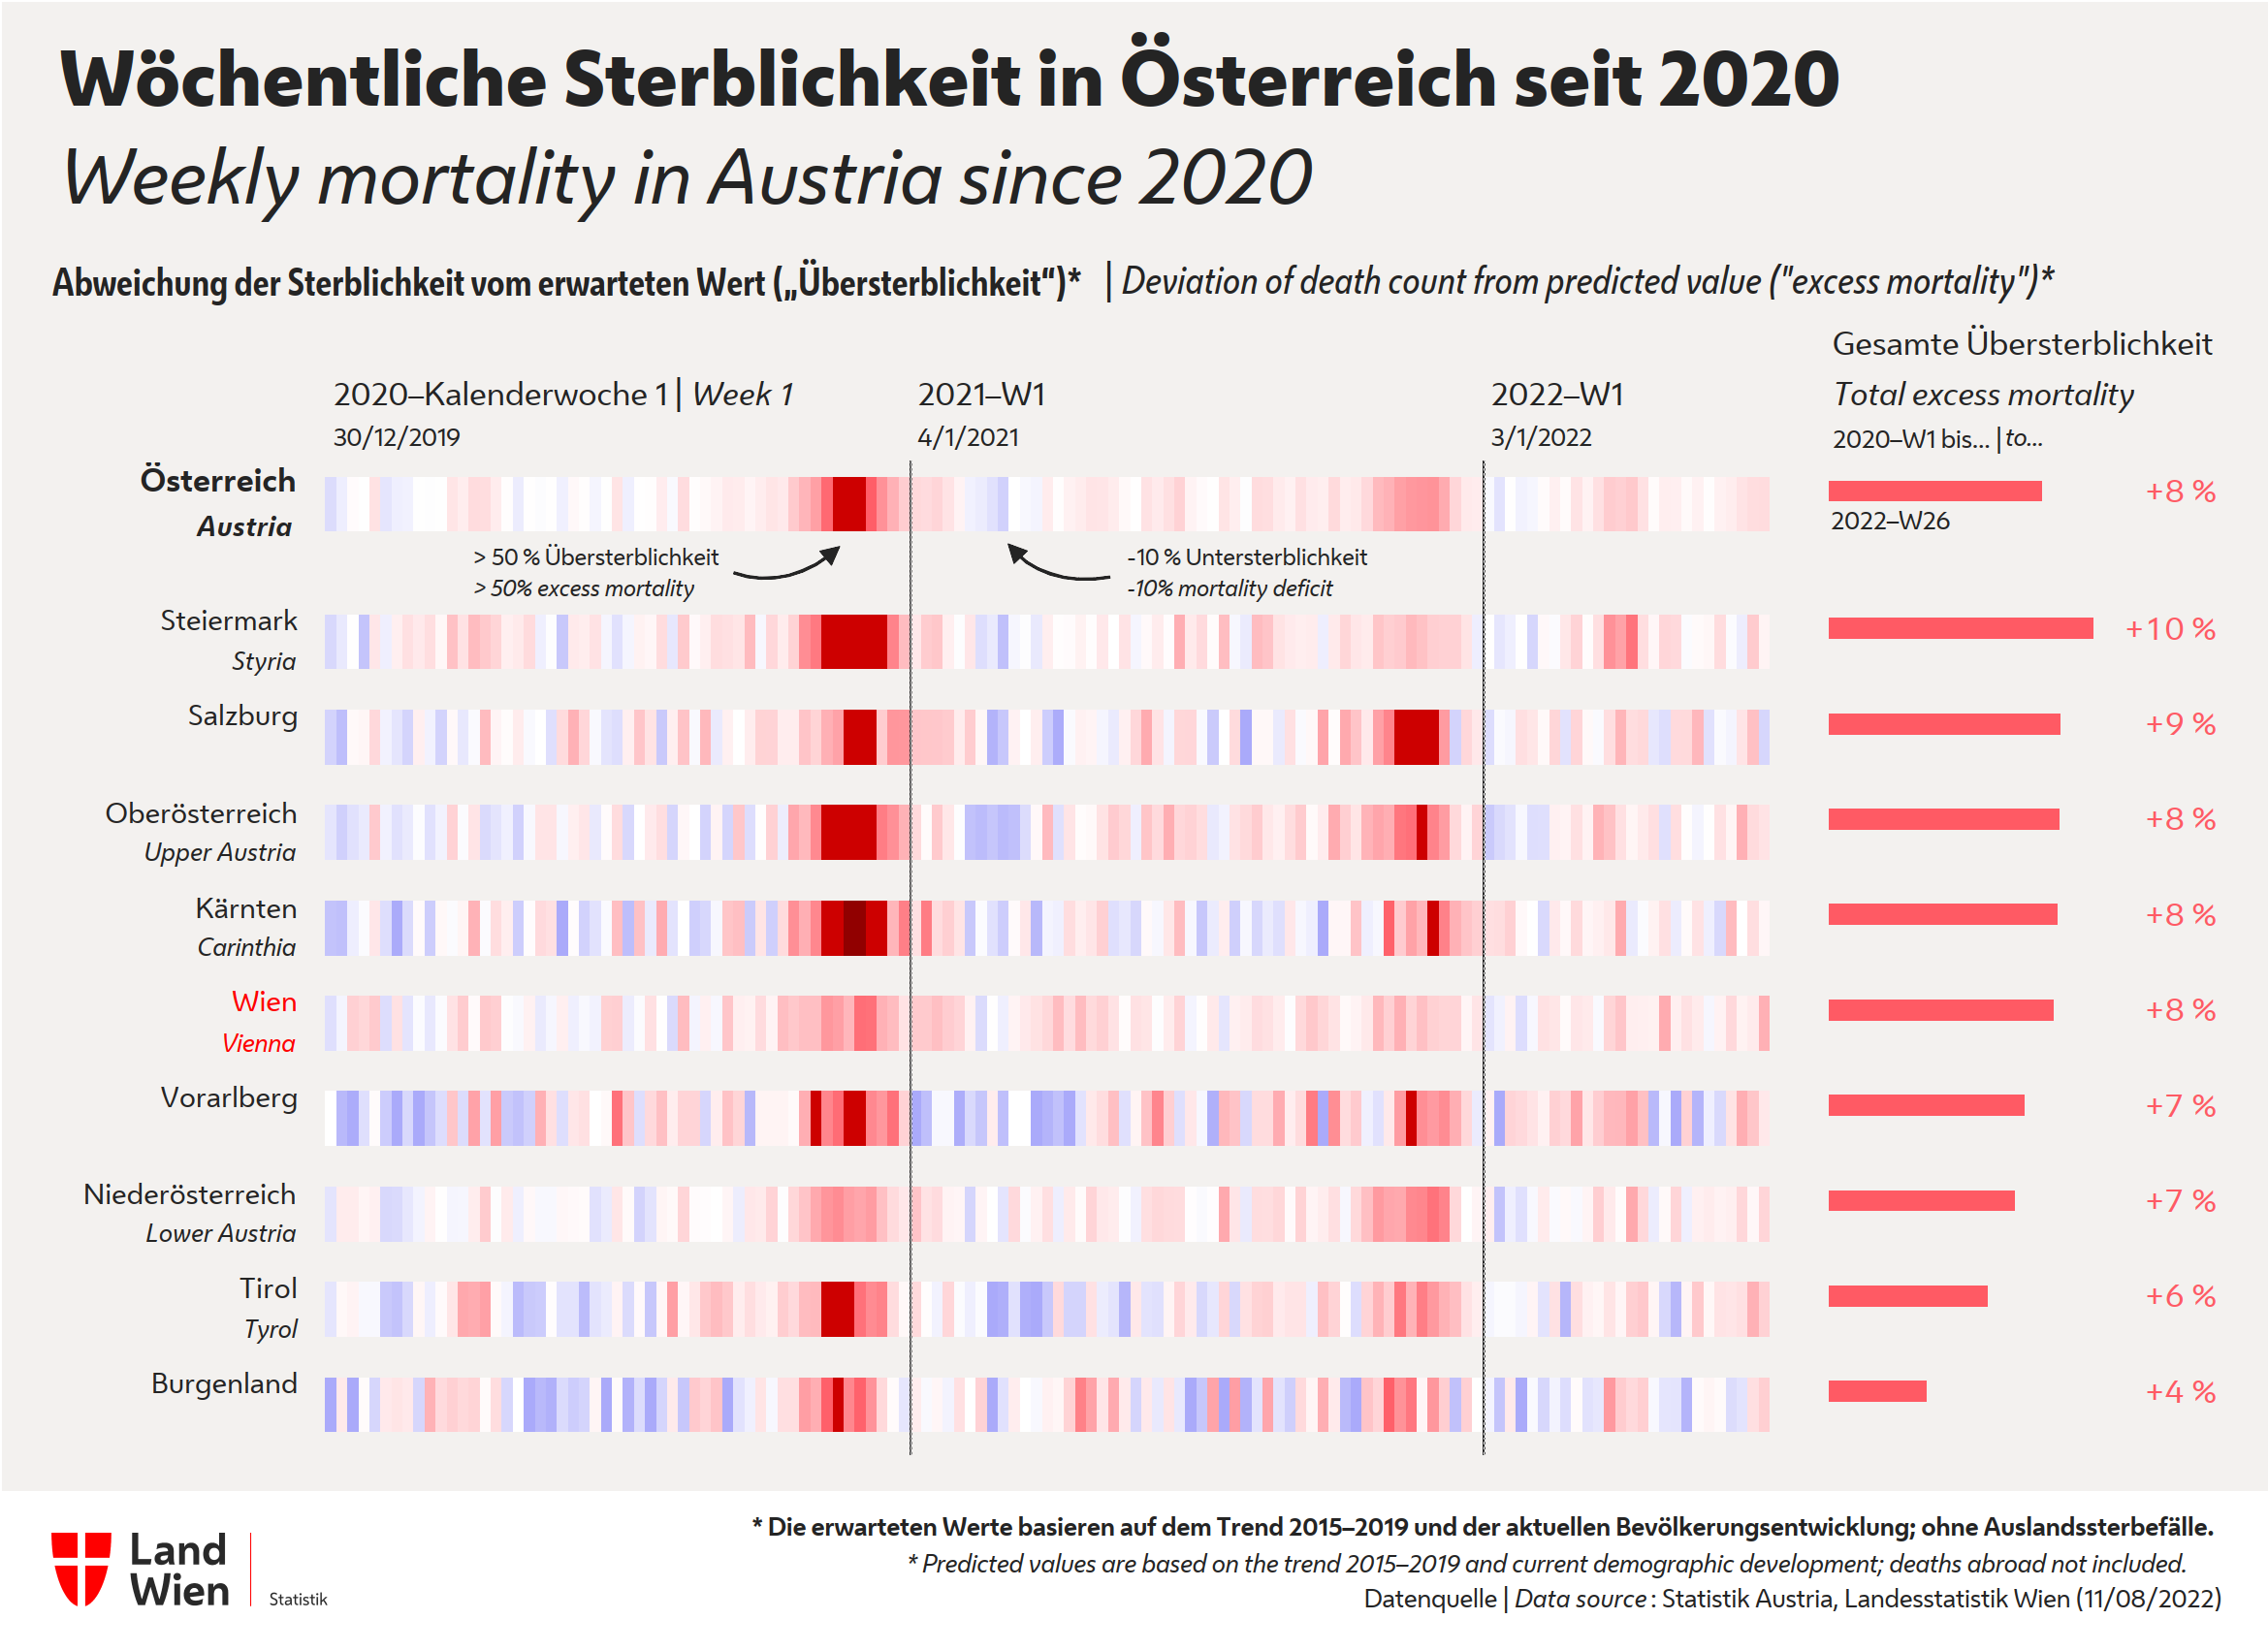
The following chart shows mortality in Austria and its nine provinces from week 1 2020 to week 26 2022 as heatmap. Excess mortality is coloured red, normal mortality white and a mortality deficit blue. Total (cumulative) mortality during the whole period is visualized on the right-hand side. This chart is no longer updated.
Many thanks to Johannes Klotz and to our colleagues at the Swiss Federal Statistical Office for their expertise and methodological support.
Data
Mortality Monitoring Austria and Vienna since 2020 (Open Government Data, Statistics Vienna)
Weekly deaths in Austria (without deaths in foreign countries) since 2000 (Statistics Austria)
More information
Vienna Mortality Monitoring 2007–2020
Mortality Monitoring in European countries and cities since 2020
Information on the Corona pandemic by the City of Vienna (in German)
EuroMOMO (European Mortality Monitoring): Current analysis of mortality in European countries